


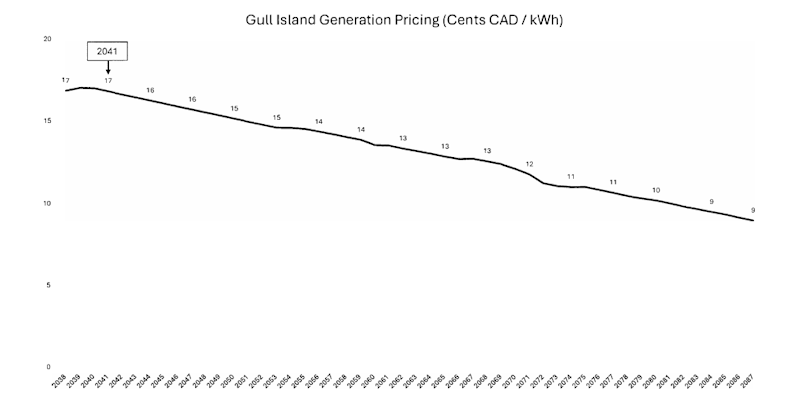
The official opposition says the government released a graph showing how the price of Gull Island Power will decrease over time, but they were not given enough time to question experts about it.
The graph shows a price of 17 cents per kWh in 2041. That price gradually decreases over the next 46 years to 9 cents per kWh in 2087.
During Question Period last night, Liberal leader John Hogan stated that the graph was released late Tuesday night, leaving them with no time to question JP Morgan or Power Advisory about it.
(Photo from NL House of Assembly Document)
Hogan says the graph shows that Quebec is getting more than this province, and asks why the government was “hiding” the graph and not allowing them to ask questions about it.
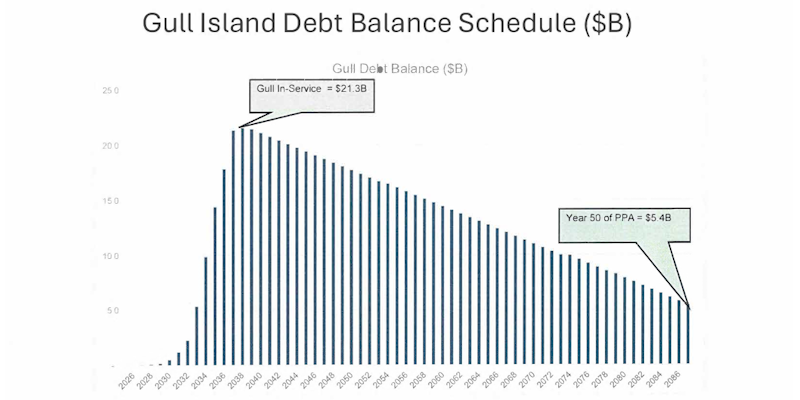
Wakeham’s rebuttal focuses on the escalator clause, which was eliminated from the new deal. He says that would have resulted in a debt of $30-billion at the end of the contract; with the way they have it structured, they will only owe $5-billion.
Those numbers are backed up by a separate chart tabled in the legislature, which shows the Gull Island debt decreasing over time.